Release Notes Jan 2024
January 4, 2024- Bulk Change to a Sales Cycle now updates Milestones
- Action Plan Step – Change Contact Type
- also requires Sales Cycle Setting
- can’t be blank
- Contact Profile – Quarantine Email now shows a reason
- Duplicate lead Accepted now launches Action Plan
- Duplicate leads created from simple lead form has been stopped
- Improvements to Username or Password Reset
- SMTP Settings UX improvement
- Searchable list of Accounts (in more places)
- Searchable list of attachments
- Contact List Search improvements
- Calendars – 2 way sync with new External Calendar Sync
- Franchise Estimate Count Report
- Emailed properly
- Links to raw data
- User Settings
- password changed immediately effects access
- archived user immediately effects access
- Archived User removed from New Lead Email
- Lead Routing – Duplicate Check for Multi-level Accounts to Subaccounts by Round Robin
- Notifications –
- Archive search to include contact name
- View Assigned User in right side panel
- Proposal
- Bid Type Multiplier
- Clear Signature now generates a History Note
- Show more of the Field Header for longer fields
- Block Editor – Cover Page, About Me, Terms and Conditions – Limited Release
- Thumbtack Integration to accept Appointments
- Templates for Notes / Log-a-Call
- Contact Profile
- Quarantine Email – now shows a reason
- Opportunity Count shows above the field
Email Franchise Estimates Reports
October 28, 2022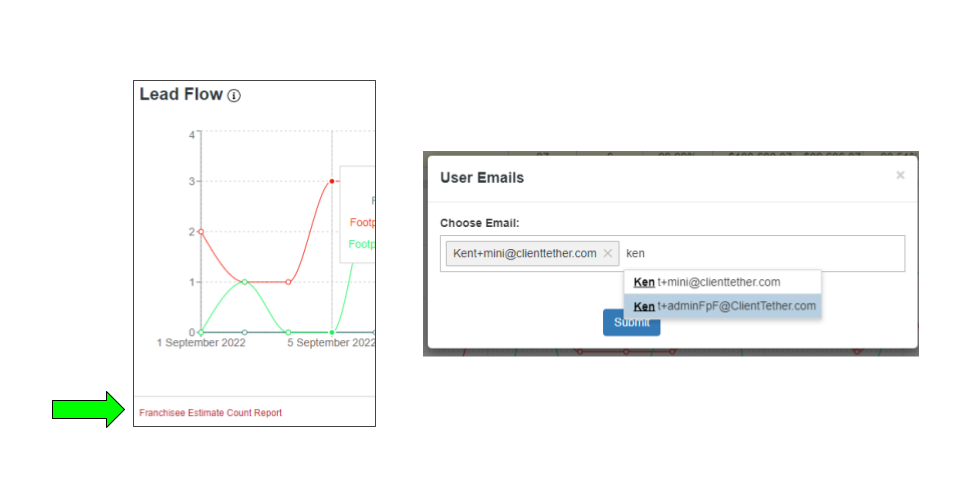
At the bottom of the Lead Flow Dashboard Chart there is a link where Users can click to get the data behind the chart. On click, the system will prompt for email address.
After the report is generated, it will be emailed.
Charts: Minutes and SMS Usage
September 21, 2022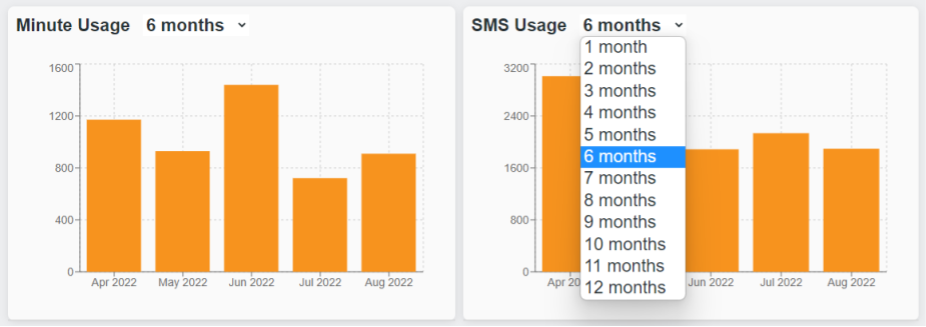
Two chart that will keep you in the know of your Minutes and SMS usage trends. You can choose between 1 and 12 months. Please understand that this chart shows is based on the the calendar month not the billing month.
Email Open Rate
September 13, 2022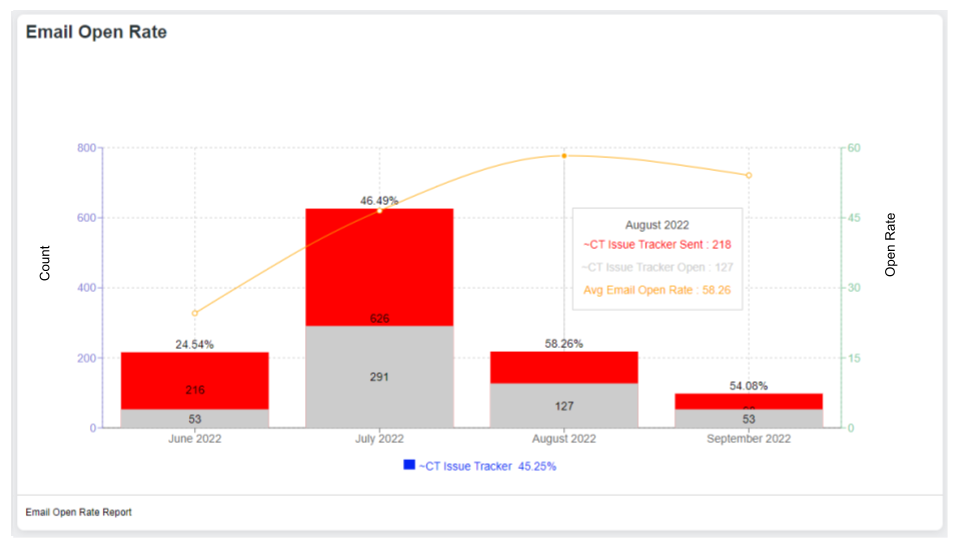
The Chart
An Email Open Rate Chart needs to show 4 things: a Date, Number Sent, Number Opened and the Percentage Opened. We have built all this in one chart. Study the image above.
The dates are shown across the bottom. These dates are sensitive to the date range you set on the Dashboard.
The number sent and opened are measured on the Left Vertical axis.
The open rate is measured against the Right Vertical Axis.
At the bottom center is the total average open rate as calculated for the whole date range.
The Data
Please understand – email open rate is not 100% accurate. However, Email Open Rates provide a good measure of contact engagement over time. The raw data making up the table is provided in the lower left for download. The data is segmented in various ways for self analysis through pivot tables.
Improving Open Rate
Improving email open rate is both a Science and an Art. Much has been written on the subject and is available for you by researching it on the internet. Here are a couple of options:
Verify your email against spam checkers
If you have concerns about your open rate, the first thing everyone should do is check your email against spam filters. One example would be Mailgenius. They will provide you with a temporary (one time use) email address where you can send an email for analysis. Their site will give you a score based on a bunch of factors. Using the titles of those factors you can continue to research each suggestion on the internet. After you have repaired all the suggestions with the email subject and body move on to Server Side improvements
Server Side Improvements
The first step would be to Authenticate our email server or use your own SMTP settings.
A second option for some accounts is having us build a custom email domain setup on our servers.
Check with your Customer Success Manager for more information.
Historical Minutes and Text Usage per Month
September 13, 2022
Historical Minutes and Text usage charts are available. You can ask for 1-12 months history and the system will show you the Chronological usage rates. Notes this does NOT synchronize with your billing cycle but it will show you a trend.
The actual number of months available are based on your start date or the feature date whichever is the shortest.