Dashboard
July 16, 2022Overview
The Dashboard is the reporting command center for the account. Data displayed within the Dashboard provides clear insights to lead acquisition, sales, team performance, lead progression, and more.
The charts and figures displayed provide actionable data that allow the monitoring of process efficiency as well as evaluations of the ROI regarding marketing and other processes.
Please note: Data displayed in the reports on the Dashboard is directly tethered to the activity of users in the system including but not limited to how accurately Leads are moved through the Sales Cycle on the Pipeline and how milestone toggles are updated within the Contact/Client profile.
Topics
- Selecting data to display on the Dashboard
- Account Features that that determine available Dashboard reports
- Data Charts available on Dashboard
Selecting Data to Display
You can adjust the data displayed in several ways
- Adjusting the Date Range
- Manually or with Speed Ranges
- Changing the Contact Type
- If you have sub accounts using the Check Boxes in the Accounts List to select which accounts’ information is being displayed.
After selecting the preferred data display options, click the “Refresh Report” button to update the Dashboard reports and review the data specific to your specifications.
Please note: You must click on the “Refresh Report” button to refresh and update the report data you have selected.
Account Features that determine available Dashboard reports
Data options and corresponding data displayed on the Dashboard will be determined by the following factors:
Single-level v. Multi-level Account Views
Multi-level View
Multi-Level view allows you to compare data for all Sub-Accounts using the Account List found in the top left corner of the dashboard.
Single-level View
If the account is Single-level, there will be no list of Sub-Accounts at the top left. Data displayed on the Dashboard will pertain to this Single-level account only.
For more information on different types of accounts click here.
Proposal System v. No Proposal System
If the Proposal feature is activated in the account, three additional data chart options will be displayed:
- Sales Report
- Collected
- Collected Sales Report
If the Proposal feature is not activated in the account, this report option will not be displayed.
For more information on Proposals click here.
The Dashboard is a powerful tool driven by data captured and compiled based on activity in the account and is provided in clearly labeled, easy to review charts. The data displayed is determined by options selected after first determining a specific Contact type and date range at top of the Dashboard reports page.
For reference and ease of navigation, please refer to the list below for current data charts available on the Dashboard.
Note: The * designates reports that are displayed if the account is utilizing the Proposal feature.
Note: The Salesperson Statistics Report will be displayed only if the Account includes Salesperson-type Users.
- Revenue Report*
- Salesperson Statistics Report
- Lead Flow
- Lead Source
- Sales Cycle Progression Rate
- Contact Clients
- Pipeline Summary for Active Path
- Client Count per Action Plan
- Activity List
- Average Job Size
- Closed Ratio
- $ Closed Ratio
- Collected*
- Collected Revenue Report Flow*
- This Month Minute Usage
- This Month SMS Usage
Revenue Report*
The Revenue Report provides a monthly report of total sales within the account and can be displayed via one of two viewing options:
- Line Chart: This comparison view is a simple line graph.
- Bar Chart: This view is a representation of the same data in a stacked graph format.
Salesperson Statistics Report
The Salesperson Statistics report displays lead data broken down into the following report options:
- New Lead Progression to Today: This option displays Lead activity data captured through today’s date ONLY for Leads that have entered the account during the selected date range indicated at top of the Dashboard.
- New Lead Based Activity within Date Range: This option displays Lead activity data captured ONLY during the selected date range and ONLY for Leads that have been added during that same selected date range indicated at the top of the Dashboard. Activity captured for Leads added to the account outside of the indicated date range will not be shown in this option.
- Any Recorded Activity within Date Range: This option displays all Lead activity captured within the selected date range regardless of when the lead entered the account.
Lead Flow
The Lead Flow report displays a monthly breakdown of total leads that have come into the account within the specified date range indicated at the top of the Dashboard menu.
Lead Source
The Lead Source report provides an exact detail of the origin of each Lead. This lead attribution is automated as Leads flow into the account from integrations including sources such as web forms, social media platform lead forms, as well as lead portals and other sources.
Sales Cycle Progression Rate
The Sales Cycle Progression Rate report is one of the most important and unique reporting tools provided on the Dashboard.
This report provided a breakdown of how leads are progressing through the Sales Cycle on the Pipeline and where leads stop engaging during the sales process.
Franchise and multi-unit businesses can utilize this tool to perform real-time comparative analysis of selected locations to evaluate strengths and weaknesses in performance across the entire sales process.
The Sales Cycle Progression Rate report displays lead data broken down into the following report options:
- New Lead Progression to Today displays Lead activity data captured through today’s date ONLY for Leads that have entered the account during the selected date range indicated at top of the Dashboard.
- New Lead Based Activity within Date Range displays Lead activity data captured ONLY during the selected date range and ONLY for Leads that have been added during that same selected date range indicated at the top of the Dashboard. Activity captured for Leads added to the account outside of the indicated date range will not be shown in this option.
- Any Recorded Activity within the Date Range displays all Lead activity captured within the selected date range regardless of when the lead entered the account.
Contact Clients
The Contact Clients report provides data on how many upcoming Contact Reminders for lead engagement are set for today, a future date, or have been missed.
Note: Current and missed Contact Reminder status is indicated by the dot color noted at the Lead name, within the Contact List and Pipeline of the account. Green dots indicate a Contact reminder active for today; Yellow dots indicate a Contact Reminder that has been missed. On the Sales Cycle within the Pipeline of the account, a gray dot will indicate an upcoming action that could include a future scheduled Contact Reminder.
Pipeline Summary for Active Path
The Pipeline Summary for Active Path report provides data on the total dollars for potential and current sales related to Leads in each stage of the “Active” Sales Cycle on the Pipeline.
Client Count per Action Plan
The Client Count per Action Plan report displays how many leads/Contacts are currently assigned to an Action Plan within the account. You can select which Action Plan client count to view by selecting that Plan from the drop-down menu.
Activity List
The Activity List report allows you to view the account activity of users/team members working with the account.
Numbers are provided for each activity they engage in, which creates a high level of transparency and accountability within your organization.
Average Job Size
The Average Job Size report allows you to view the average job size within your account broken down into the following categories
- Assigned User
- Lead Source
- Service*
- Zip Code
- Quote Type
This data provides a clear picture of which factors are involved in potentially bringing in the largest job sizes.
Please note: Data displayed in this report is derived from use of the use of the “Quoted” and “Closed” milestone toggles located at the top menu of of the Client/Contact Profile within the account.
Closed Ratio
The Closed Ratio report allows you to view how many new Leads have “Closed” first by selecting either to view New Leads only or Any Lead via the toggle, then broken down into the following categories:
- Assigned User
- Lead Source
- Service*
- Zip Code
- Quote Type
This allows you to view which factors are driving higher close ratios. This data will allow you to make confident decisions regarding which marketing investments are generating ROI and which should be abandoned or altered.
Please note: Data displayed in this report is derived from use of the use of the “Quoted” and “Closed” milestone toggles located at the top menu of of the Client/Contact Profile within the account.
$ Closed Ratio
The $ Closed Ratio report allows you view total revenue of “Closed'” Leads first by selecting either to view New Leads only or Any Lead via the toggle, then broken down into the following categories:
- Assigned User
- Lead Source
- Service*
- Zip Code
- Quote Type
Please note: Data displayed in this report is derived from use of the use of the “Quoted” and “Closed” milestone toggles located at the top menu of of the Client/Contact Profile within the account.
Collected*
The Collected report allows you to view total dollars collected for the specific Contact type and within the designated date range. This data is broken down into the following categories:
- Assigned User
- Lead Source
- Service*
- Postal Code
- Quote Type
Collected Revenue Report Flow*
The Collected Revenue Report Flow allows you to view total dollars collected each month within your designated date range, and displays it in a stacked graphic. This data is broken down into the following categories:
- Assigned User
- Lead Source
- Postal Code
- Quote Type
Historical Usage per Month
Historical Minutes and Text usage charts are available. You can ask for 1-8 months history and the system will show you the Chronological usage rates. Notes this does NOT synchronize with your billing cycle but it will give you a trend per month.
This Month Minute Usage
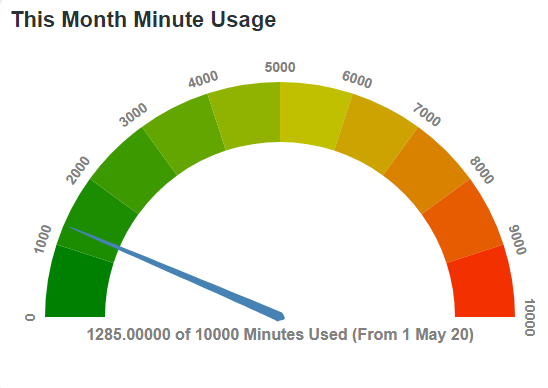
The Month Minute Usage counter displays the total number of phone service minutes utilized by all users in the account during the current invoicing period. This includes minutes used for both outbound calls (manual and via Action Plans, etc.) as well as inbound/return calls to the designated account phone number.
This Month SMS Usage
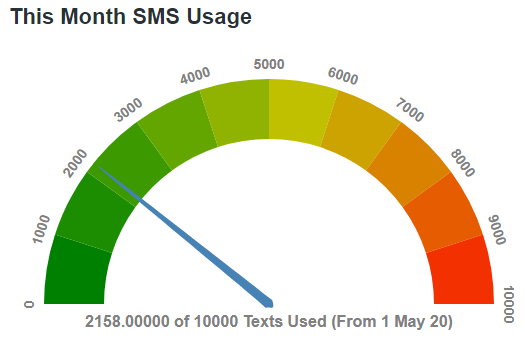
The Month SMS Usage counter displays the total number of text message segments both sent from and received by the designated account phone number during the current invoicing period. Please note: A text segment is counted as 150 characters.
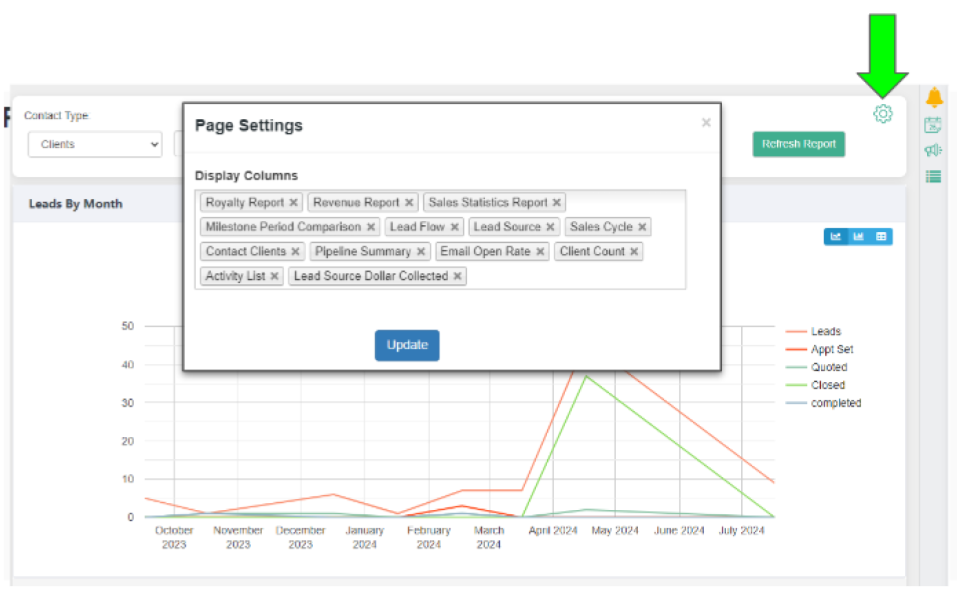
Steps to Control the Charts Displayed on Your Dashboard
- Activate Dashboard:
- Ensure that the Dashboard page is active by clicking on the Dashboard main menu.
- Show/Hide Specific Charts:
- Go to the Page Settings by clicking the gear icon (indicated by the green arrow) on the dashboard interface.
- In the Page Settings dialog, you will see a list of available charts under “Display Columns.”
- Use the checkboxes to remove undesired Charts
- To restore charts click in the multi-select field to see available options. Click on the desired chart.
- Click the “Update” button to apply the changes.
Example:
The image provided shows an example of the settings interface where you can manage your dashboard charts. Use this interface to customize the visibility and layout of various reports and charts according to your preferences.